SHAPES MODULE
In this module there are 3 important classes on the user point of view:
- Shape - handles each shape element, either a point cloud (only vertices) or a mesh (vertices and faces
- ShapeDataset - handles a set of shape elements (all of the same type) and includes methods for plotting, transforming shapes or saving them to files
- RegDataset - handles a set of registered shape elements with respect to a given template, obtained from the registration procedure. Includes the deformed template obtained from the registration as well as the correspondence vectors for each shape.
ShapeDataset
A dataset must be instanciated with a given dimension dim, which all its shapes must respect
from dataset import ShapeDataset

dim = 3
dataset = ShapeDataset(dim)
Adding new shapes
New shapes can be added with methods add_mesh or add_shape depending on the type of data. The set of shapes is then stored in a dictionary shapes_dict, with the respective shape id has keys and an object shape as values. Below we provide an example to add a new a mesh and a new point set - note that different kinds cannot be included in the same dataset.
- Adding a new point set shape
import numpy as np

id = 0
pts = np.random.rand(20,3)
dataset.add_shape(id, pts)
- Adding a new mesh shape
import numpy as np

id = 0
vertices = np.random.rand(20, 3)
faces = np.random.randint(0, 20, (30,3))
dataset.add_mesh(id, vertices, faces)
Creating altered datasets
The following methods return a new ShapeDataset with a given modification. They can be applied to specific shapes by defining id_list. Below we provide an example of a modification.
- struct_missing_data - removes data points in a given bounding box
- struct_missing_data_ID - removes data points by their id
- random_missing_data - randomly removes a given percentage of data points
- random_noisy_data - adds noise with a given variance to each data point
- outliers_uniform - randomly places a given ratio of outliers within a bounding box of each shape
- outliers_struct - randomly places a given ratio of outliers within a defined region
id_list = [2,3,4]
miss_ratio = 0.8
dataset_transf = dataset.random_missing_data(miss_ratio,id_list)
Saving shapes to files
All the shapes in the dataset can be saved into a dest_folder with different file formats. If one wishes to save only the shape points the available formats are ‘.csv’ and ‘.txt’. For meshes, there are ‘.ply’ or ‘.stl’ - if a dataset has only point clouds, 3D meshes will be generated with Open3D. Below is an example of this method.
dest_folder = './Results'
file_type = 'ply'
dataset.save_to_files(dest_folder,file_type)
RegDataset
This object is obtained as an output of a registration method. It contains information on the registration method used and the results obtained - the deformed template for each shape and the retrieved correspondences. We cover the most important attributes and methods from the user point of view.
Results from registration
The following attributes contain the output from any registration method.
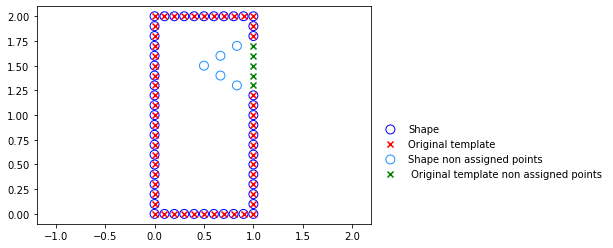
- corr_by_template - dictionary with keys as shapes ids and values are a list of correspondences in the point of view of the template, i.e. the number of elements equals the number of target points, the ids indicate the target point for a given template point and ‘nan’ values indicate a missing point.
- corr_by_target - similar to corr_by_template but in the point of view of the target.
- def_src_dict - dictionary where each shape id is associated to the deformed template matrix obtained
Useful plotting functions
The following are useful methods to plot registered shapes where one can visualize the correspondences obtained. Note that these are mostly suitable for 2D data.
- plot_2_shapes - plots 2 different shapes in the dataset with the correspondences obtained. For a more clear result, a subset of correspondences can be specified. Non connected points are also identified.
- plot_template_and_shape - plots two figures, one with the original template and the target, and one with the deformed template and the target. Both include the visualization of the correspondences.
Below we show how to call this method with all correspondences visible and a representative result.
id = 1
reg_dataset.plot_template_and_shape(id, begin = 0, end = 'all')

